Where to start when you want to do reporting?
•
Used in businesses, reporting is an essential internal tool, yet one must know how it works.
What is reporting?
The term reporting is an English expression, referring to the communication of data. It is a tool that allows for the presentation of a report on the activities and results of a company, by providing data collected over a period. It can take several forms, such as tables or graphs, and highlights key performance indicators. It is of real importance in business to easily track the periodic evolution of performance indicators. Moreover, this fairly general tool has the advantage of being usable in all sectors of activity.
Why do reporting?
Firstly, reporting will provide you with a clear visualization of your company's health by grouping various key performance indicators, which is necessary to steer your company and make decisions. It can be useful to highlight good or bad practices within the company and modify them if necessary. If you have multiple locations, for example, several restaurants, it will help you compare and analyze the activities and performances of these locations to retain only the best practices and apply them to each. However, for it to be effective and useful, it is necessary to follow several steps in order to save time and create the most optimal reporting possible.
The steps to follow for effective reporting
To create good reporting, it is advisable to follow several tips that will make your task easier. To be effective, it must be readable, capture the attention of its recipient, be relevant, and allow for easy conclusions to be drawn. To meet these needs, here are the steps to consider when creating your first report:
- Its objective: first of all, it is essential to understand the reason for which you need to create this report to know what information should appear in it. Therefore, it is important to focus on the expected final result and think about all the data points that you would like to see displayed in your reporting. You should consider:
Off-balance sheet data such as important commercial or marketing data for your business (number of clients, quantity of products sold X or Y, etc.)
Accounting data: turnover, expenses. It is important to think about how you want to display this information and at what level of detail. For example, you might decide to display your energy costs analytically by separating water, electricity, and gas costs.
- The period on which your data focuses (monthly, quarterly, biannual, ...). We recommend that all companies do reporting at least monthly.
- Your data collection. Some data will be stored in your business software, such as the cash register, and other data in your accounting software. During this step, each data point that you deemed important in the first step must be retrievable. For example, if you decided to analytically analyze your energy costs distributed between water, electricity, and gas, your accountant will need to do the same in the accounting software. This is why step 1 is the most important, as when you present your reporting to your accountant (who will be the first point of contact for providing accounting data), they will know how to set up the necessary accounting process to feed this reporting.
- The frequency at which your data will be retrieved: for this, you can use many tools such as Qotid to automatically feed your reporting. It is possible to do manual updates, but these can be time-consuming for your collaborators and often lead to delays and errors. Furthermore, for several reasons, Excel is one of the software we advise against, and we explain why in this article.
- The medium used for your reporting, paper, Excel, digital? manual or automatic? We certainly recommend digital reporting. Access to information is automatic, requires less effort, and your data is less likely to be compromised. Using user-friendly software will allow any collaborator to create a management report from the data points you decided to collect in the first step without going through an IT or management control service.
- Finally, when you start collecting data on your chosen medium, you can establish how you will visualize the results, using graphs, curves, diagrams, tables...
It is important to carry out these steps in order for your reporting to be a good motivational tool; the choice of data is important, and it is better to focus on the most relevant data than to choose too much and risk losing the recipient's interest. Should you consider the audience to whom your presentation is directed? Indeed, if it is aimed at your team, the indicators will likely not be the same as if it were addressed to your management. You should provide information of interest to each person to engage them and ensure that your presentation is useful to them. This step can be done at the end, as for all the data points you considered relevant to collect, you can pick from it to display only the important information according to the recipient. The formatting of your reporting is very important. For it to be a success, it must be clear and understandable; thus, you need to think about how you will represent each indicator and, above all, make them attractive and visual. You should also not forget to contextualize the information by adding captions, comments, titles, etc.

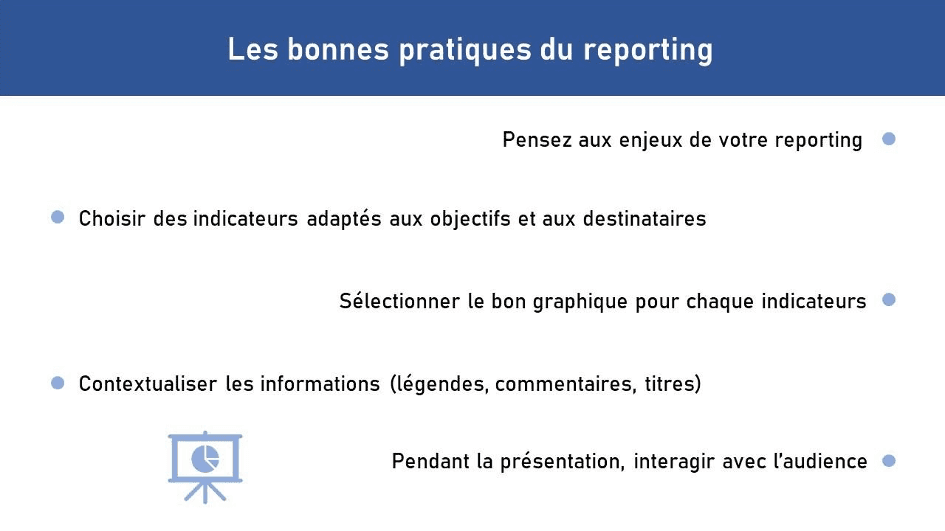
Good practices to remember
Here are the main tips to keep in mind when creating and presenting your first report.
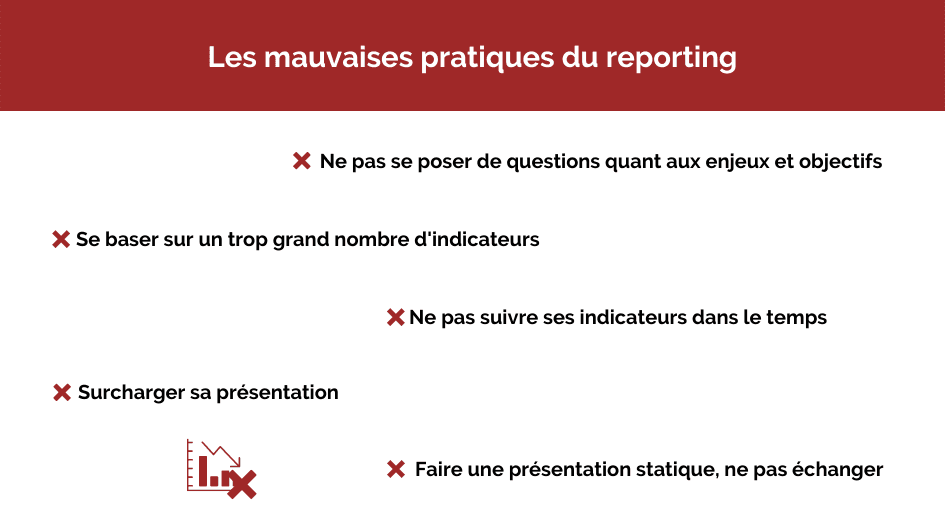
Bad practices of reporting
Here are things you should avoid, so as not to get lost in preparing your reporting, but also not to lose your audience during its presentation.
Starting your reporting
You now know the key points to start creating your reporting. This tool will give you insight into the health of your organization, as well as a perspective on the future. It will allow you to make the right decisions and better lead your company. To make formatting easier and not spend time on Excel, it is now possible to use many tools that combine speed and ease of use, allowing you to create a clear report almost instantly. This is one of the features offered by our Qotid application, which allows you to save considerable time on this type of task, whether you have a first reporting base or not. You will thus be able to focus on higher value-added tasks. Our main goal is to simplify and automate the reporting creation process for businesses.
Reporting is an essential tool for businesses, so it is necessary to use it periodically to track the evolution of your performance and thus pursue your development.