
How to create a report? Examples and tools
lucas-fontaine
•
Jul 8, 2024
The creation of a reporting may seem intimidating. First, the amount of data coming from different sources can be very time-consuming. Next, analyzing and structuring the data into relevant indicators for the business can also be a real challenge.
However, despite these apparent difficulties, the creation and analysis of a reporting can be simplified and optimized with the right tools and best practices.
In this article, we will show you how to create a reporting and revisit the limitations of certain tools.
The importance of financial reporting
The reporting presents several major advantages for businesses.
First, it allows for the collection and analysis of relevant data, which provides better visibility into performance and results. Furthermore, this tool allows for measuring performance against set objectives, evaluating the effectiveness of actions taken, and identifying areas for improvement. Finally, reporting enables the identification of potential risks and the implementation of appropriate preventive measures.
Moreover, financial reporting is particularly important as it plays a crucial role in strategic decision-making. On one hand, this type of software allows for clear and transparent communication of financial results to various stakeholders (internal and external). On the other hand, it allows you to track your revenue and expenses. Additionally, financial reporting enables you to compare your forecasts with your actual figures to monitor your objectives.
Example of reporting
Here is an example of financial reporting completed via the Qotid solution.
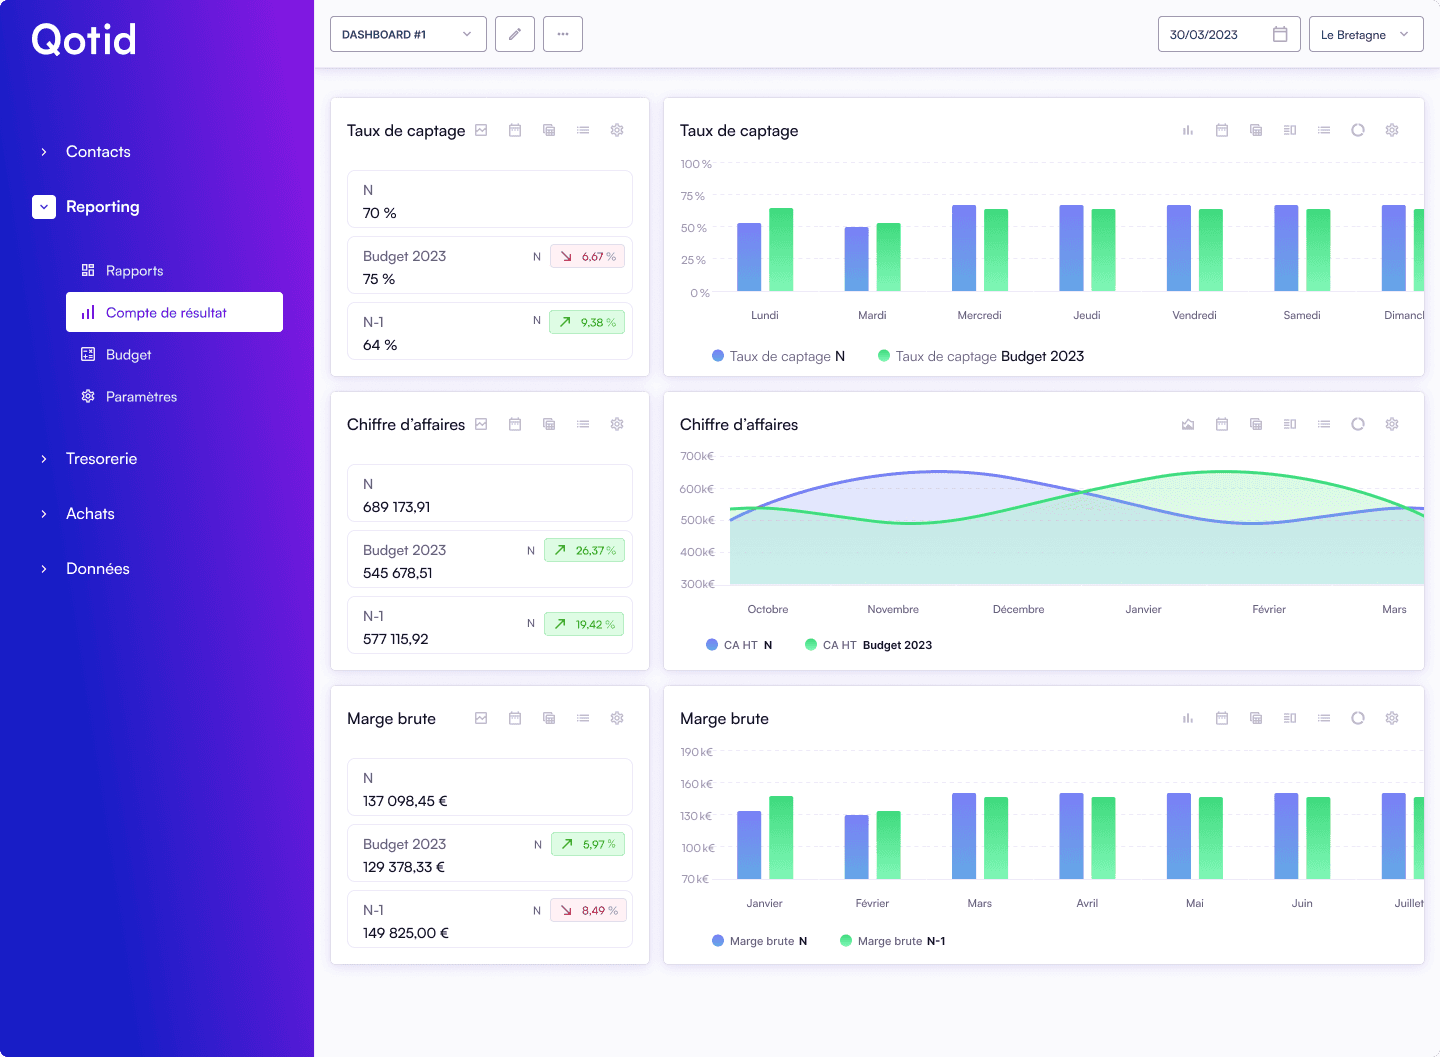
It should be noted that a reporting can be customized with different performance indicators depending on the sector and the company’s objectives.
Nevertheless, financial reporting always includes, unless otherwise noted, revenue, expenses, and profits.
How often should reporting be done?
The frequency of reporting depends on several factors, such as the nature of the company's activities, the needs of collaborators, and management objectives, etc.
In theory, a weekly reporting can be beneficial for maintaining constant oversight of activities and reacting almost in real-time to significant changes in KPIs.
However, it should be noted that in practice, few companies conduct weekly reporting.
In fact, regarding financial reporting, it is more common to opt for monthly reporting or quarterly reporting.
Monthly reporting is indeed the most commonly used frequency for many companies.
This allows for gathering and analyzing financial data more thoroughly, including key indicators such as revenue, expenses, profit margins, cash flows, etc. Regular frequency financial reporting provides a comprehensive view of the company's financial health and thus facilitates decision-making.
It is important to note that the frequency of reporting can vary from one company to another and should be adapted based on the specific needs and constraints of each organization.
Excel, a reporting tool with limitations
What tools should be used to create good reporting?
The most well-known of all is of course: Excel reporting (or Google Sheets). Excel is a very commonly used software for data collection.
Given its popularity, it is quite normal that the first idea you have for building your reporting is to use a spreadsheet. However, be aware that this tool also has many limitations.
- Using a spreadsheet presents risks of errors: As your business develops, the amount of data you will need to handle will also increase. Manipulating data in Excel is a manual process, extremely sensitive to input errors. A simple cell with an incorrect formula and your reporting will be entirely wrong…
- Spreadsheets are quite complex to maintain: Even if the data source location is known, it is not easy to identify errors in an Excel formula.
- Excel is limited in terms of layout and automation : Reports are not visually appealing. Moreover, novice users must turn to colleagues with advanced training in Excel to create advanced reports.
Finally, it can be complicated to get real-time data with a spreadsheet given the number of manual actions required.
- Spreadsheets pose risks to your data security: your data in a spreadsheet can easily be copied/pasted, even sent to competitors!
Although reporting software is essential for all businesses, there is nothing more unpleasant than spending all your time entering data into an Excel spreadsheet.
Reporting should be visual, convey messages, lead to (good) decisions... In short, it should be enjoyable!

How to create good reporting?
To establish effective reporting, it is essential to follow a structured approach. Without further ado, here are the 5 key steps to successful reporting.
Step 1: Determine the objectives and data to collect: Determining your objectives and identifying relevant indicators to monitor will help you select the necessary data to evaluate performance and make informed decisions.
Step 2: Collect the data: After determining your objectives, it is necessary to collect the various data from the tools used in your organization, such as your business tools, accounting tools, and other management tools.
Step 3: Organize and analyze the data: Dashboards will provide a clear and concise visualization of key indicators, thus facilitating understanding and interpretation of the data by all.
Step 4: Pay attention to form and facilitate interpretation: Making indicators visually "appealing" is also a significant part of the work (graphics, colors, legends, dashboards, etc.)
It will be easier to identify trends, discrepancies, or opportunities for improvement.
Step 5: Communicate the results: Finally, communicate results clearly and concisely to your collaborators, emphasizing key conclusions and recommended actions. The reporting process is iterative, so it is important to regularly assess and adjust your practices to ensure it remains relevant and useful.
By following these five steps, you can establish solid reporting that supports informed decision-making and your company’s performance.
Qotid, the custom solution to manage your financial data
Qotid is an all-in-one SaaS solution for financial management and performance monitoring aimed at small and medium enterprises (SMEs) and multi-establishment groups. Qotid is a comprehensive solution for centralizing, visualizing, and automating financial operations. With Qotid, you can consolidate data from all your establishments onto a single platform and create custom reports and dashboards to monitor your business's profitability in real-time. Specifically, you can connect your accounting software and your business software (PMS, cash register, POS, etc.) to create personalized reports and income statements. Qotid also allows you to create unlimited budgets and scenarios and analyze your performances and variances (N, N-1, Budget).

In conclusion:
Although creating a reporting may be intimidating, with the amount of data to manage and the resulting analytical challenges, this article demonstrates that with the right tools and practices, this task can be simplified and optimized.
Financial reporting is of crucial importance for companies, offering visibility on performance, facilitating strategic decision-making, and allowing for the identification of areas for improvement and potential risks. While Excel reporting remains popular, its limitations concerning errors, complexity, and data security underscore the need for more specialized solutions.
F.A.Q :
1. What is the difference between a dashboard and reporting?
Reporting is the representation of KPIs in the form of an activity report. We generally talk about weekly, monthly, or quarterly reporting. It is a broader process ranging from data collection to analysis.
The dashboard , on the other hand, is generally used daily. It focuses on the analysis of specific indicators in real-time.
2. Who creates the dashboard?
People in charge of finance or accounting. They use their business expertise and knowledge of strategic objectives to identify the relevant key performance indicators (KPIs) that need to be monitored.
3. What is the purpose of financial reporting?
The main purpose of financial reporting is to provide a clear, precise, and regular overview of a company's financial performance over a given period. Reporting serves to guide managers and their teams in making better decisions.