The 7 best automated reporting software in 2024
Amber Baynaud
•
Jul 8, 2024
A good business management encompasses several areas (finance, HR, marketing, sales, logistics, etc.) and is based on reliable decisions, both at the operational and strategic level.
However, in order to make the right decisions, entrepreneurs are obliged to conduct thorough data analyses. It is in this context that reporting or management reports come into play.
The reporting means in French: "communication of data." Reporting thus involves creating dashboards, graphs, and diagrams that communicate a set of data previously collected and analyzed. These reports aim to enlighten executives regarding their decisions by allowing them to draw relevant conclusions based on concrete data.
Discover in this article the best automated reporting solutions on the market in 2024, as well as their main selection criteria and advantages for your company.
What is a reporting tool?
A reporting tool is a tool designed to collect, organize, analyze, or present data in a concrete, clear, and understandable manner for business executives.
These tools simplify the creation of reports or dashboards to save considerable time and optimize the visualization of essential information related to the company's performance.
Reporting tools connect to various data sources, catalog a large amount of information, and present it in the form of dashboards, graphs, diagrams, etc.
Data collection can thus be done through manual entry, by connecting to existing databases, or via other applications that may or may not allow the automation of reporting.
The primary goal of a reporting tool is to present the collected data in the form of visually appealing and easily interpretable performance indicators (KPI) to enable executives and various stakeholders to make decisions more effectively.
Moreover, there are many types of reporting depending on the business areas, which you can find in our dedicated article.
Why automate reporting?
The automation of reporting for businesses offers numerous tangible benefits.
Time optimization
The company saves a considerable amount of time in collecting accounting and financial data. All data related to the company's financial health is retrieved and utilized in a very short time.
Cost savings
The effectiveness of employees is enhanced. In a company, data collection and reporting steps are often repetitive and time-consuming. Automation would allow employees to reduce the time spent on manual tasks and focus on higher value-added tasks, thus resulting in cost savings.
Reduction of entry errors
Entry errors are significantly minimized. The reliability of the collected data is guaranteed, which is an essential element for being able to produce representative financial reports and make informed decisions.
Personalization of reports
Users can easily customize their reporting according to their specific needs.
Accessibility
Thanks to automated reporting, reports are easily accessible by all collaborators, which enhances communication, collaboration, and transparency.
Real-time tracking
The key performance indicators necessary for the preparation of reports are tracked in real time through the automation of the tool.
Qotid allows complete automation of your reports thanks to its many features. Discover here how to automate your reporting.
How to choose the right reporting tool?
The software market, particularly tools specialized in reporting automation, is highly competitive. Although these tools cater to companies of various sizes and budgets, there are many tools offering such solutions.
To stand out from this competition, SaaS solutions must offer efficient services at competitive prices.
Businesses should gather information and assess all their current and future needs to find the perfect solution for them.
When a company invests in such a high-performance SaaS solution, their primary goal is to save time to focus on their core business. However, if the solution is not well-thought-out, this sought-after advantage could become a real hindrance to the company's activities.

The selection criteria are numerous:
Connection to various data sources
Ensure that the tool is capable of connecting to and extracting a large amount of data from various sources, to perform the most suitable reporting.
Ease of use
The user interface should be relatively ergonomic and straightforward to use. You should be able to start using the software quickly, without any specific training required.
License fee
The subscription cost of your reporting automation tool undoubtedly guides your final choice. These prices are set based on the position of the solution in the market as well as the range of features offered in the package. Compare these prices with those of competitors and evaluate them.
Our comparison (which comes in the next section of this article) of the 7 best automated reporting software includes, of course, their pricing.
Hidden costs associated with the tool
Reporting automation tools may have hidden costs related to the solution. For example, maintenance fees, training, implementation, technical support, integrations, or any other associated costs.
Features
Understanding your needs concretely is essential. It is crucial to analyze the functionalities of reporting automation software, prioritize them to find a package that includes all features that perfectly meet your requirements. Data visualization, automation, customization. SaaS solution features typically consist of 80% standard features and 20% specific features.
Here are the standard features your reporting software should include:
Automation of data collection,
Data analysis,
Data visualization,
Personalization of dashboards,
Export of reports.
Tool adaptability
The tool must be scalable and reliable. It should maintain its performance even if the company's activity grows (especially if the number of users significantly increases) and be capable of installing new updates.
Support and resources
Ensure that the tool provider offers support and resources to help collaborators use the solution and become autonomous.
Data security
Ensure that the tool guarantees data security by complying with current standards and regulations, particularly those related to confidentiality and data integrity.
The 7 best automated reporting tools
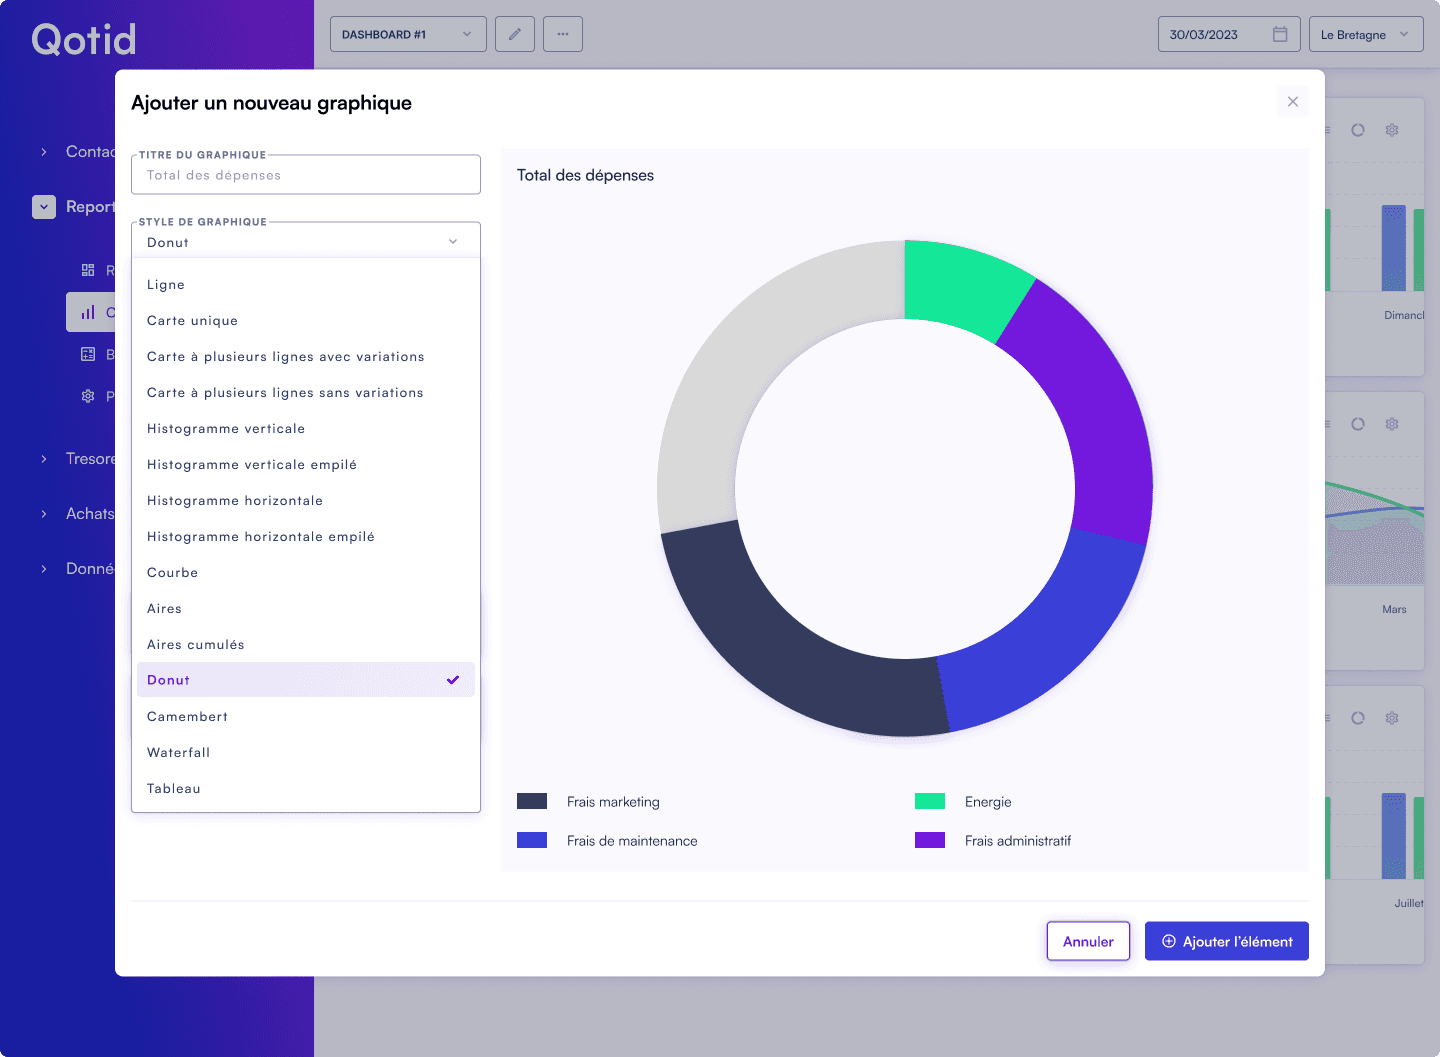
Qotid
Advantages
Qotid is the most accessible financial BI reporting solution on the market and the most comprehensive for multi-site groups. Its range of features is very complete and offers solutions and support across various levels of financial management (Purchasing, cash management, BI, and reporting).
Qotid benefits from an integrated ETL. Data is stored in the cloud, and maintenance is handled by internal teams. Therefore, there are no hidden costs or management fees to consider.
It is a "no code" solution, meaning that no programming skills are required.
Qotid adapts according to clients from multi-site or single-site groups. The tool also has predictive features allowing for budget realization and visualization of future data.
Disadvantages
Qotid focuses solely on finance, and the options for data visualization are fewer than on other reporting tools.
Targets
TPE/ PME/ ETI
Multi-site groups
Financial departments
Pricing
Starting at €49 HT/month for TPE.
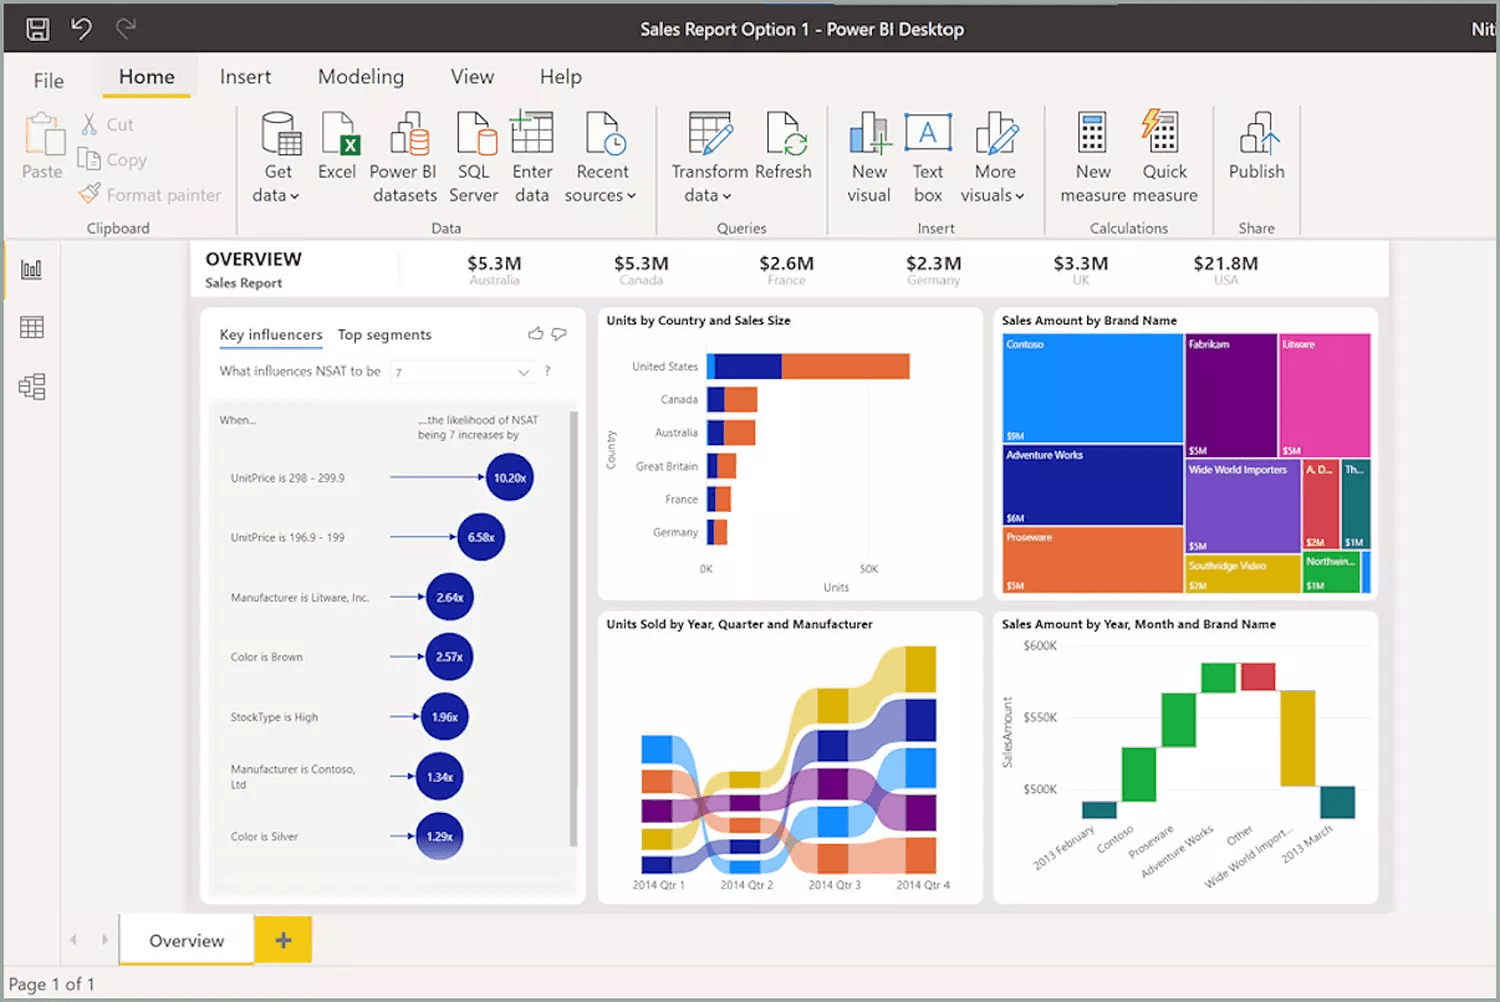
Power BI
Advantages
Power BI is a Business Intelligence solution developed by Microsoft. Secure, powerful, and accessible to all due to its competitive prices, Power BI is aimed at IT professionals, analysts, developers, etc.
Its goal? To contain raw data and transform it into usable data.
Power BI is very easy to use for basic and intermediate analyses.
Collaboration is greatly simplified as everyone has access to the tool and can contribute to the creation of dashboards, diagrams, etc.
Disadvantages
On Power BI, you cannot share information with members outside of your organization without a premium account.
The learning curve can be somewhat difficult when analyses become more advanced.
For some features, the software can be complex due to the lack of internal guidance to assist users.
Additional integration fees may be required.
Targets
TPE/ PME/ ETI
Pricing
Starting at €9.40 HT/month per user.
Pentaho
Advantages
Pentaho is an open-source ETL that allows manipulating and transforming a significant amount of data. It is a very comprehensive tool equipped with JavaScript functions, data import/export, numerous connectors providing access to many databases and files of different formats.
Pentaho also has advanced features like clustering.
There is a free version of Pentaho, which is also easy to use but naturally has fewer features.
Disadvantages
Pentaho users do not find many disadvantages. However, some think that the features offered might be too many, making configuration of the software difficult.
Targets
All companies and anyone needing data analysis.
Pricing
Free version.
Prices available upon request.
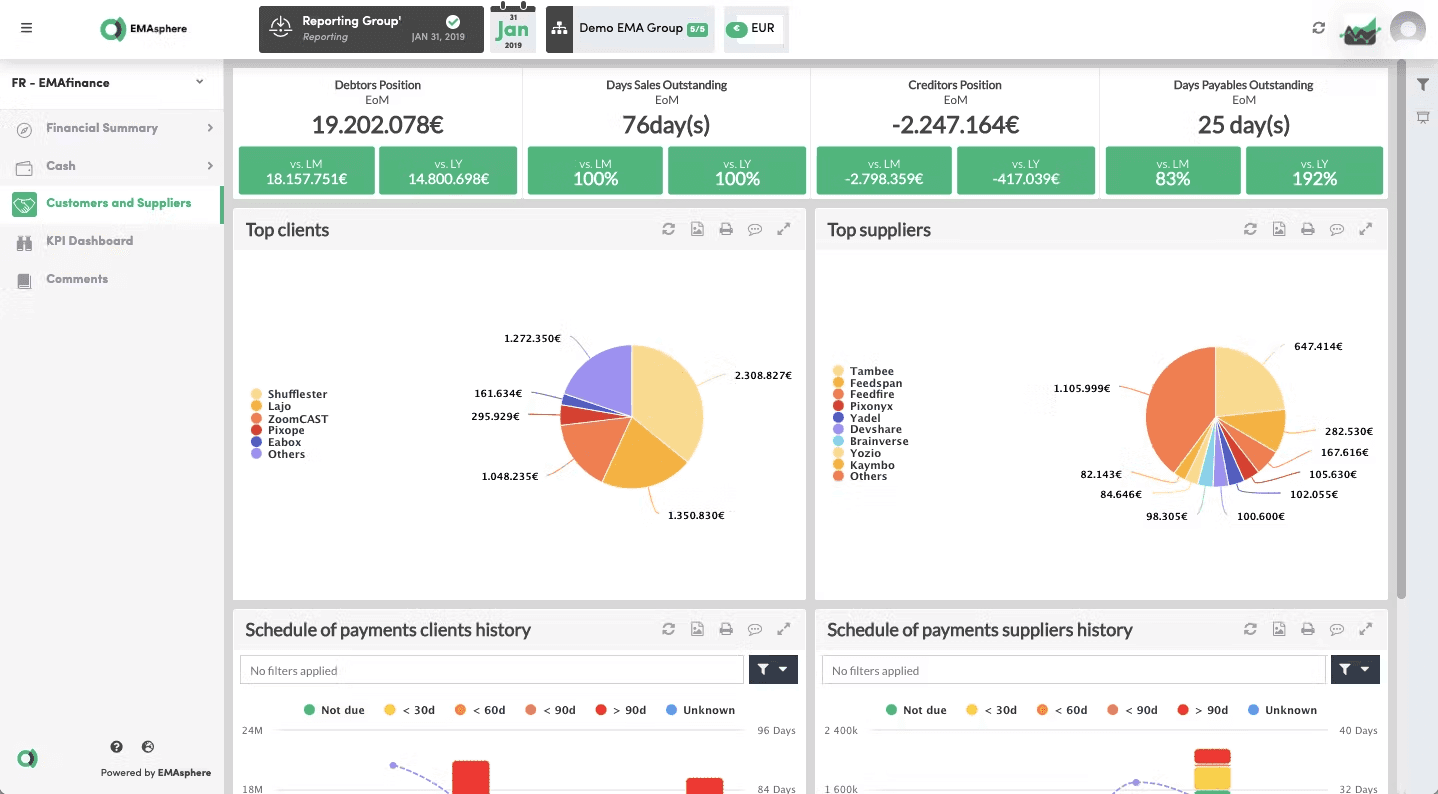
EMAsphere
Advantages
EMAsphere is a software that allows visualization of current and future data. Dashboards and KPIs can be pre-configured and customizable, which means that users have complete control over their reporting.
EMAsphere can import numerous data via different systems and filter important information related to the company's financial health.
The tool also offers an alert system allowing for proactive management.
This solution is accessible anywhere and by anyone, making it a collaborative solution.
Disadvantages
Although the tool is very efficient and relatively easy to use, some users find the setup to be quite complex for those who are inexperienced.
Targets
All companies, regardless of size.
Pricing
Free trial and pricing upon request.
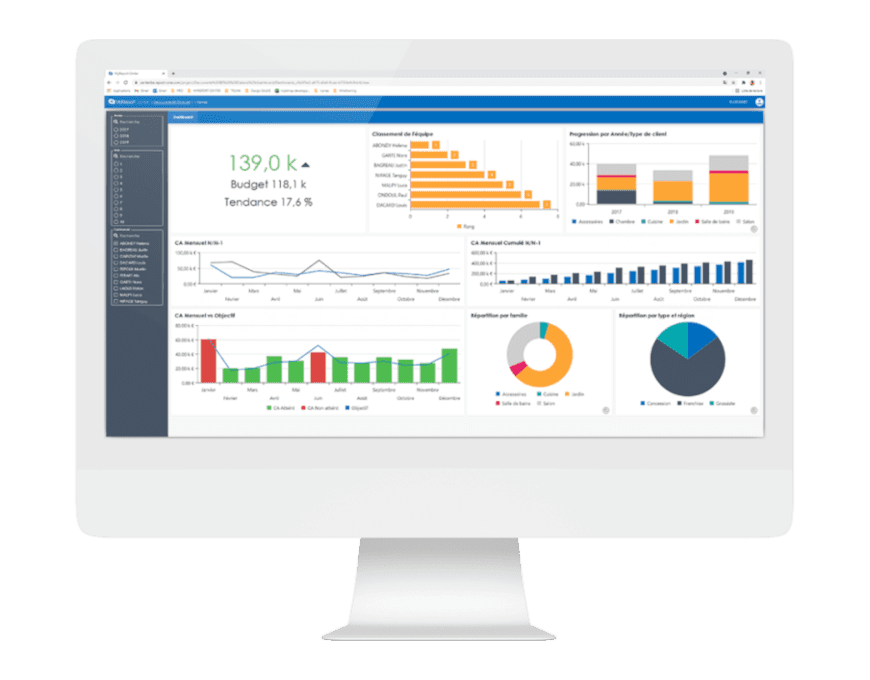
My Report
Advantages
My Report is a Business Intelligence solution designed to centralize, analyze, and share data simply. Suitable for all types of professions (financial, administrative, sales director, etc.), My Report serves as a real decision-support tool.
It has all the advantages of Excel and is perfectly suited for beginners. It encompasses three pillars: Data Management, Data Visualization, and Data Analysis. Thus, it is an all-in-one solution that is easy to handle and effective.
Disadvantages
This solution will require, in addition to its initial license price, other costs related to maintenance, training, or integration.
Furthermore, My Report does not allow the creation of any graphic. When needs become more advanced, My Report may not be the most suitable software.
Targets
PME & ETI
All types of professions
Pricing
Pricing upon request + additional costs to consider
Sage BI
Advantages
Sage BI reporting is a Business Intelligence solution. It allows the creation and enrichment of Excel dashboards, based on well-considered and analyzed data. Sage allows advanced analyses and data collection to highlight essential information.
It is a decision-making and collaborative tool intended for all professions within a company.
Disadvantages
Some users find it problematic to juggle between two software like Sage and Excel and would like to see all their data centralized in the same place.
Targets
All business sectors & all levels (commercial manager, CFO, production manager, etc.)
TPE/ PME/ ETI
Pricing
Starting at €47 HT or upon request.
Tableau
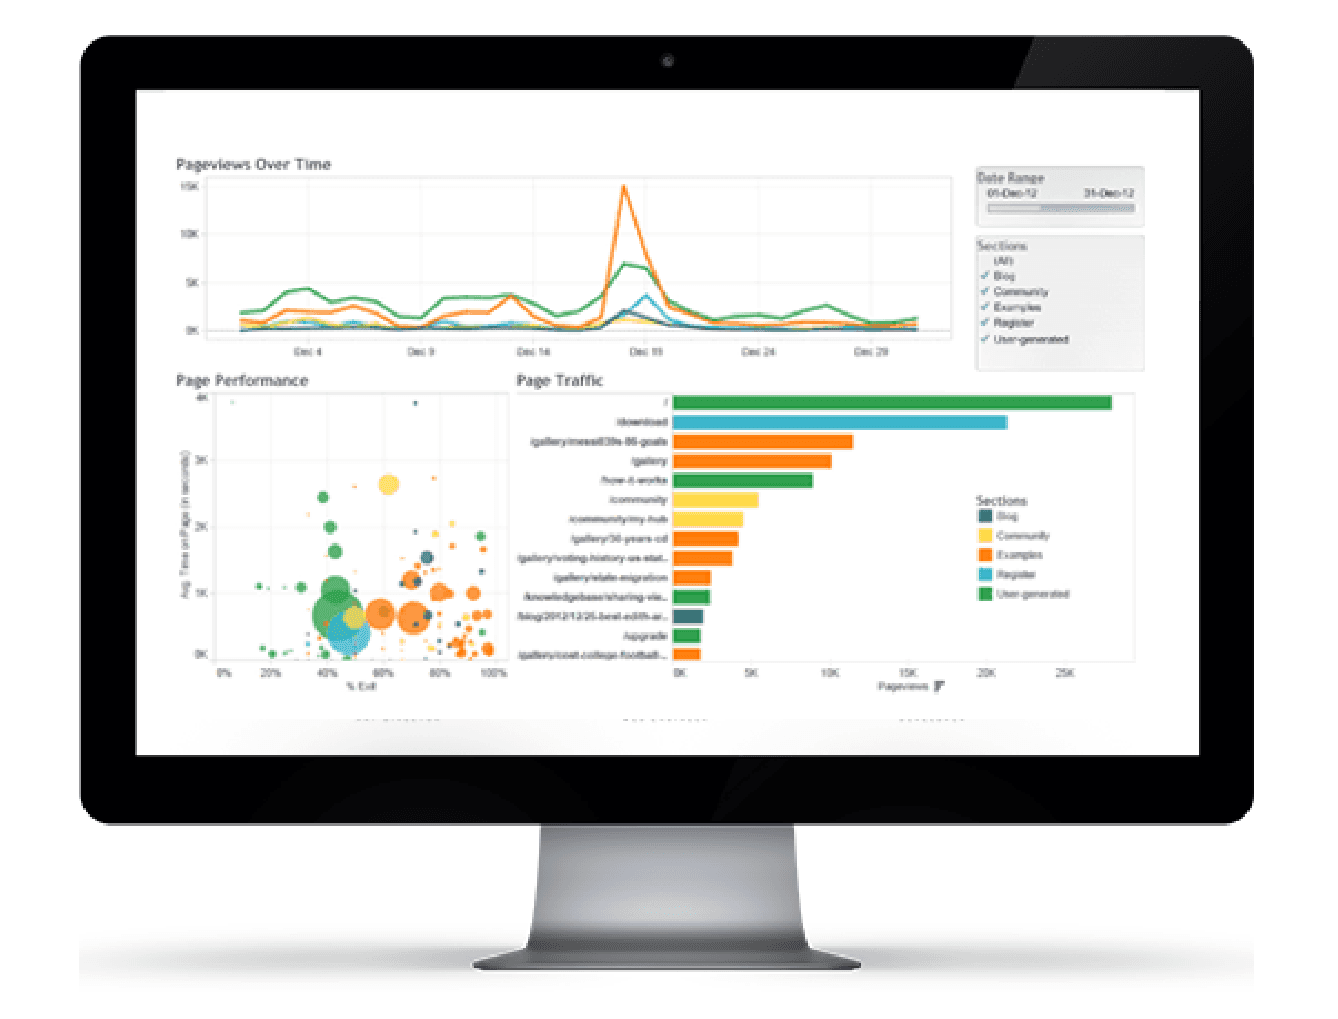
Advantages
Tableau is a Business Intelligence solution. Powerful, fast, and featuring numerous connectors, it is a reference tool alongside Power BI for data visualization.
Tableau has many features and very advanced analyses, making its handling somewhat more complicated.
The integration of Tableau into a community helps better understand its operation as well as provide advice for optimizing its use.
Disadvantages
According to some users, support and customer service are considered the least efficient on the market.
Numerous hidden costs associated with maintenance, integrations, or necessary training must be anticipated.
Some features require some knowledge of programming language.
Targets
ETI
Pricing
Starting at €42 HT/month/user.

Qotid: A solution for reporting automation
Qotid aims to become the most complete all-in-one and no-code financial management solution on the market, aimed at SMEs and financial departments nationwide and across Europe.
Qotid's mission is to help executives manage their financial accounts. The business teams of any company can thus oversee their performance by controlling all their financial data centralized on the same tool. From managing purchases to creating reports and overseeing cash flow, financial directors have full control over their company's finances.
Therefore, Qotid provides, through its ergonomic and flexible interface, complete support aimed at enlightening executives' decisions while leaving them autonomous in creating their reports.
Moreover, Qotid's powerful data visualization and automation capabilities enable users to quickly read and understand their reports.
Qotid requires no programming skills and is accessible to all types of users.