
The performance indicators of a company
Amber Baynaud
•
Jul 8, 2024
All entrepreneurs, financial management teams, and leaders of small or medium-sized enterprises have a specific goal: to improve or at least stabilize their company’s performance.
The performance of a company is defined by its ability to achieve its objectives, whether financial or operational. Many elements contribute to this performance such as financial results but also customer satisfaction, product quality, social and environmental responsibility, and many others.
This performance can be measured with revenue, stock levels, new markets, new products, etc. These are specific indicators, called performance indicators, which will allow for an effective measurement of whether the company is being managed correctly. In addition to real-time monitoring of the company’s performance, leaders are alerted as soon as the situation deteriorates so that they can opt for a strategic change and make necessary decisions. However, implementing these indicators requires a method to ensure effectiveness. This article will guide you and explain the essential information to help you determine which management control KPIs are most suitable for your business and how to implement them.
Indicators: Tools for Measuring Company Performance
Performance indicators, also known as KPIs (Key Performance Indicators), allow both the measurement of the company’s financial health and the orientation of the decision-making processes of the leaders.
These indicators measure the company’s activity in its various domains:
Finance and accounting: they provide information related to the company’s financial health and profitability.
Operations: they assess the effectiveness of production and resource management.
Sales: they evaluate the effectiveness of sales strategies.
Marketing: they measure brand image and the perception of the company by others.
Customer service: they measure customer service quality and customer satisfaction.
These indicators thus allow companies to have a comprehensive view of their activity. They can highlight what works very well and, conversely, what works less well, prompting the leader to make appropriate decisions, namely correcting errors or increasing their activity.

Performance Indicators in Management Control
The business leader has a vested interest in establishing a list of performance indicators that is as relevant as possible to have a global overview of their activity.
This list is included in a category of KPIs that we call: management control indicators. But what does this mean? These indicators reflect the gap that may exist between the set objectives and the actual results. Common to almost all companies, we have grouped them in this article, oriented towards the hospitality and restaurant sectors. Here is a list of these various indicators:
Financial Performance Indicators
The financial performance indicators aim to highlight information related to the profitability of the activity, investments, and the financial health of the company. These indicators may include:
Revenue,
Net accounting result,
Break-even point,
Return on investment,
Market share evolution compared to competitors,
Working capital requirement,
EBITDA,
And many other indicators can still be used to report the financial performance of the company.
Commercial Indicators
Commercial indicators will provide an indication of customer satisfaction and the quality of the customer relationship. Generally, these indicators may include:
Sales made for each category of products or services,
Sales made for each working area,
Conversion rate of advertising campaigns,
Satisfaction rate (opinion surveys, complaint figures, etc.),
Customer retention rate.
These indicators can be exploited by almost all companies.
Performance Indicators
Performance indicators are essential when one wishes to measure the financial state of their establishment, track the evolution of its performance, and support the achievement of already set goals.
In the hospitality sector, these management indicators serve as true tools to assist in managing the activity.
In the Hotel Sector
The choice of relevant KPI and careful monitoring enables hotel leaders to make effective decisions. They will thus be able to compare their objectives with new data and have a clear view of their hotel’s overall health. Furthermore, the indicators allow them to clearly identify the factors influencing their company’s performance.
Here are the main indicators to use to measure a hotel’s performance:
The average rate per occupied room (or ADR).
The average rate per occupied room represents the daily average price of the various hotel rooms. This indicator is interesting to analyze as it first allows comparison of the average price set with the price of the previous year. It then helps analyze its impact on the hotel’s occupancy rate. The leader could quickly analyze whether prices have a positive or negative influence on the occupancy rate. He will then be able to make appropriate decisions to maintain prices, increase them, or decrease them.
ADR = room revenue / number of rooms rented
The revenue per available room (REVPAR).
The revenue per available room allows one to know how much revenue is generated by each available room. In other words, it gives the leader a view of the number of rented rooms and the income generated by these reservations. Its calculation helps understand the best way to maximize revenue generated from rooms. If REVPAR increases, it means either that the average room prices have gone up, or that the occupancy rate has increased, or both.
REVPAR = ADR x occupancy rate
or
Total room revenue / total number of available rooms
The average revenue generated per customer (REVPAC).
The average revenue generated per customer represents the total amount of revenue generated by customers staying at the hotel. The goal is to obtain an average revenue that would allow hotel leaders to make forecasts. For example, taking into account the hotel’s occupancy rate and the time of year, the leader could maximize this revenue by upgrading a loyal customer, which would average a certain premium, to free a room that could be rented to someone else. This action could potentially take place if it corresponds to a time of year when large rooms are usually not rented out. Multiple actions like this could be implemented to optimize the revenue generated per customer.
REVPAC = total revenue generated by customers / number of customers staying at the hotel
The average length of stay.
The length of stays is an important variable that affects hotel revenues. This indicator helps leaders make pricing decisions. Ideally, not too many customers should stay just one night, but there should also not be too many customers staying several weeks.
When a customer stays just one night, the leader needs to find out who will occupy the room next, must have the necessary staff for cleaning, or the staff who will welcome the new customers.
Conversely, if a customer stays several weeks, it prevents the hotel leader from changing their prices if a market opportunity arises, for example. They will thus not be able to attract new guests at higher prices. The hotel could miss an opportunity to earn additional revenue.
The occupancy rate.
The occupancy rate is a very important performance indicator that informs the number of rooms occupied compared to the number of rooms available over a given period. A hotel's occupancy rate can be easily influenced by the type of hotel, its location, and the experience of the guests. It goes without saying that a hotel located in the mountains will experience a much higher occupancy rate in winter than in summer. Therefore, it is preferable to compare this rate with those of competitors for a more representative idea. However, there are many ways to increase this occupancy rate. It is possible to set better rates, make promotions or offer systems, target the right markets, partner with local businesses, take advantage of local events, etc.
Occupancy rate = total number of occupied rooms / total number of available rooms
In the Restaurant Sector
These tools must be implemented from the restaurant's opening, and then monitored as rigorously as possible to obtain representative data. Performance indicators are key tools that help improve the profitability of your restaurant, as well as optimize its performance and productivity.
As a result, the business leader will be able to analyze in real-time the performance of their restaurant, obtain clear and precise explanations about its operation, and thus be able to make effective, relevant, and quick decisions that would increase the profits made, optimize customer satisfaction, and improve the quality of the dishes.
Here are the main performance indicators to follow in a restaurant:
The restaurant's filling rate.
This filling rate or occupancy rate is a very important performance indicator. It informs the number of occupied tables compared to the number of available tables over a given period. The higher the filling rate, the better the table rotation management and the higher the attendance.
Filling rate = number of reserved or occupied tables / total number of tables x 100
The attendance rate.
This rate allows for a better understanding of the restaurant's success among customers by comparing its attendance across days, weeks, or even years. Based on the results, the establishment leaders might decide to implement marketing and/or commercial operations to further boost the restaurant.
Attendance rate = number of covers served / restaurant capacity x 100
The average ticket per customer.
The average ticket per customer represents the average expenditure of each customer during a meal at the restaurant. It is an important performance indicator as it highlights the quality of the culinary offerings, sales capacity, or the appropriateness of the offerings. The establishment should aim to improve this average ticket per customer by concretely identifying its target. It should study the budget and consumption habits of its clientele in order to best adapt their offering.
Average ticket per customer = revenue / number of covers
The customer satisfaction level.
The customer satisfaction level is essential and is influenced by various criteria such as the quality of service in the dining hall, the quality-price ratio, the quality of dishes, the welcome, and customer feedback after their meals, reviews, and online testimonials. The customer experience must be analyzed by the establishment leaders to effectively optimize customer management.
Online evaluations, mystery visits, staff feedback, satisfaction tests, etc.
The stock rotation rate.
This corresponds to the number of times stocks have been sold or replaced over a given period. If stock rotation is high, it means that the stocks are selling quickly and that raw materials are rapidly transformed and sold to customers. The restaurant thus generates more revenue.
Stock rotation = revenue / average stock
Average stock = (beginning of year stock + end of year stock) / 2
How to Choose Performance Indicators Suitable for Your Business?
KPIs allow measuring the performance of the company. It is essential that they are well chosen and adapted to the company's sector of activity to effectively identify its strengths and areas for improvement.
There is no point in drowning in an endless number of performance indicators. It is better to establish a preselection so as to use only indicators that are significant relative to your company's activity.
The Benefits of a Good Performance Indicator
Using the right management indicators will enable you to more easily detect weaknesses and the strategies to implement to optimize the profitability and productivity of your company.
Choosing the right indicator has several advantages.
Clarity of objectives: When a performance indicator is set, it clarifies the company’s specific objectives to be achieved. For example, if the indicator is revenue, the clear objective is to maximize it.
The company’s strategy: All the performance indicators used are aligned with the company’s overall strategy and may even enhance it.
Performance evaluation: The more concrete the chosen indicators, the more representative they will be of the company’s actual performance. It will thus be easier for leaders to clearly identify the strengths and weaknesses of the activity and take the necessary corrective measures.
Informed decision-making: A representative indicator can guide and justify all decisions made by the leaders.
Accountability of teams: The use of clear and measurable performance indicators could help teams hold themselves accountable. If each team has tangible objectives to achieve, they could gain in productivity.
Internal and external communication: Having good indicators would simplify communication based on objective figures that could be used, for example, for negotiations with suppliers, investors, etc.
Monitoring evolution: By closely monitoring the key indicators related to the company’s activity, leaders can quickly identify different trends and adapt accordingly to remain competitive in the market.
Choosing the right KPI is therefore essential for allowing a company to develop and increase its profitability and productivity. To best choose them, it is preferable to follow a precise method.
A Precise Method
You will have understood, among all the numbers, it is important to only calculate figures that are truly meaningful with respect to your company’s activity. Certain steps must be followed to help you best identify the right performance indicators.
Specify Objectives
A performance indicator is always linked to a specific objective. Its mission? To determine whether the initial objective set has been achieved. For example, if the objective is to increase sales by 30%, it is possible to set an indicator that would be the number of sales per day. It will therefore be easy, at the end of the month, to assess whether this indicator has met the objective. However, if there is not originally a clear objective, it will not be possible to choose a truly useful indicator that can measure a precise data.
These objectives must therefore be realistic and set precisely so as to associate with them the most relevant indicators.
Associate an Objective with a KPI
The idea is then to associate at least one indicator with each of these objectives that must be realistic. The set indicators must be:
Defined in time, and have a pace of evolution and a monitoring periodicity specified (weekly, monthly, quarterly…).
Adapted to your recurring problems and to your activity.
Measurable easily and provide data on the past, present, and future to be able to supply sufficient information regarding the management of the company.
Simple and chosen to ensure a balance between financial and non-financial indicators to maximize the choices of action levers.
Assigned to a clearly identified reference person. It is important to involve all operational collaborators in the choice of these indicators to ensure that they perfectly fit their needs.
Define Means to Achieve Objectives
It is then essential to create an action plan detailing all the means the company will need to implement to achieve its objectives. This strategy must bring together all the objectives, all members of the company, and their roles within this strategy. This will then trigger a measurable action that the indicators can analyze.
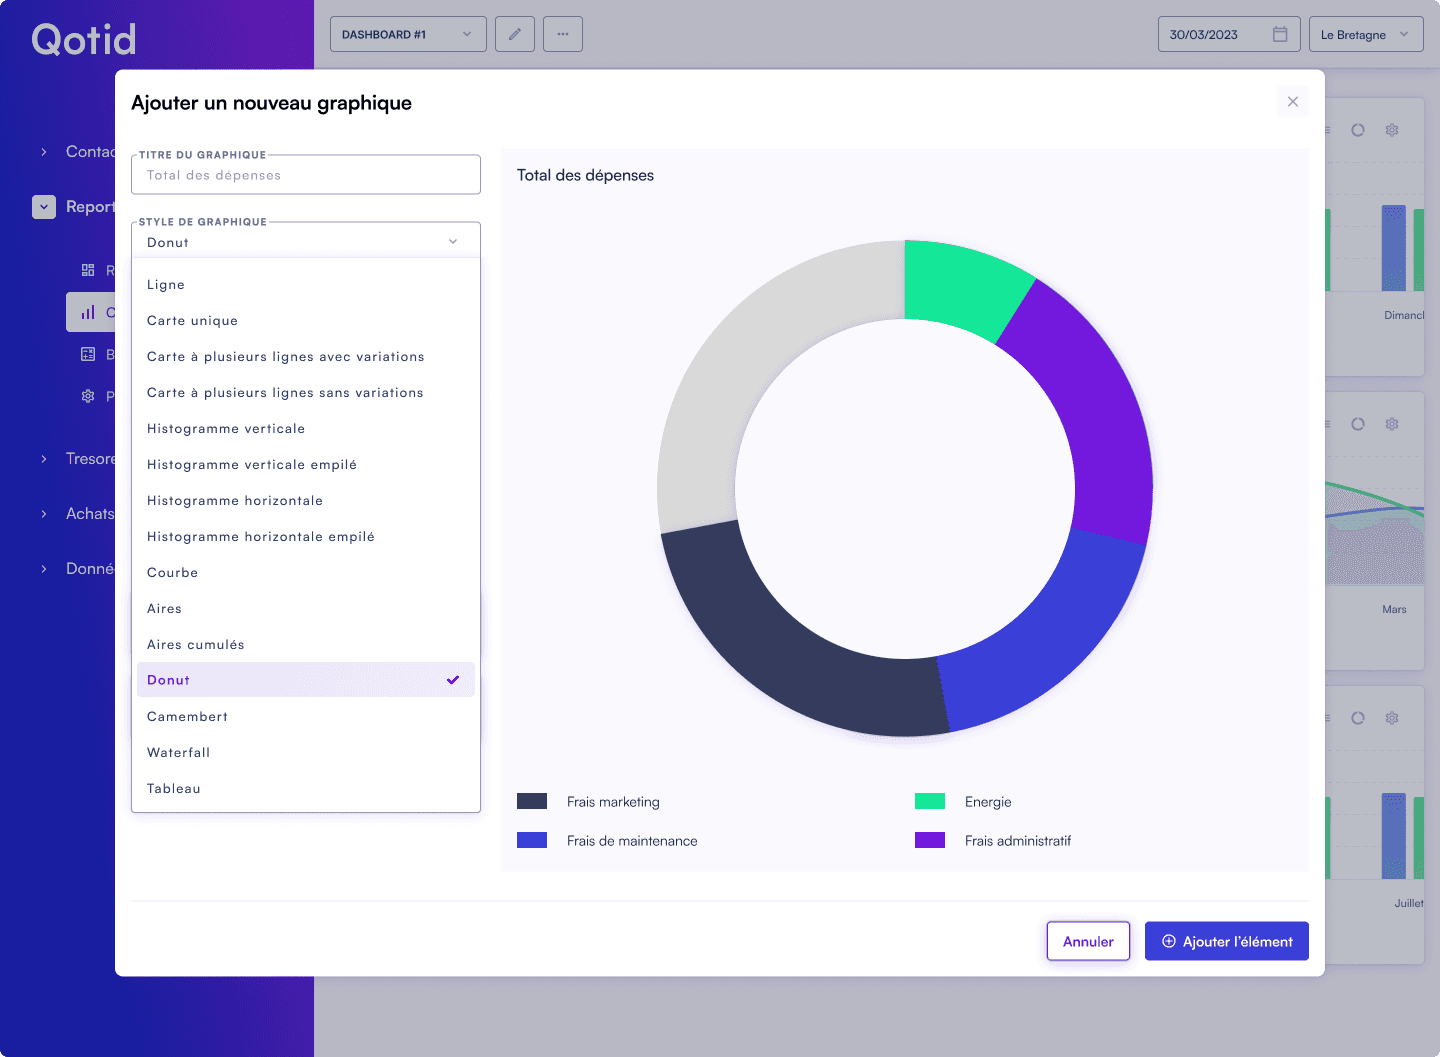
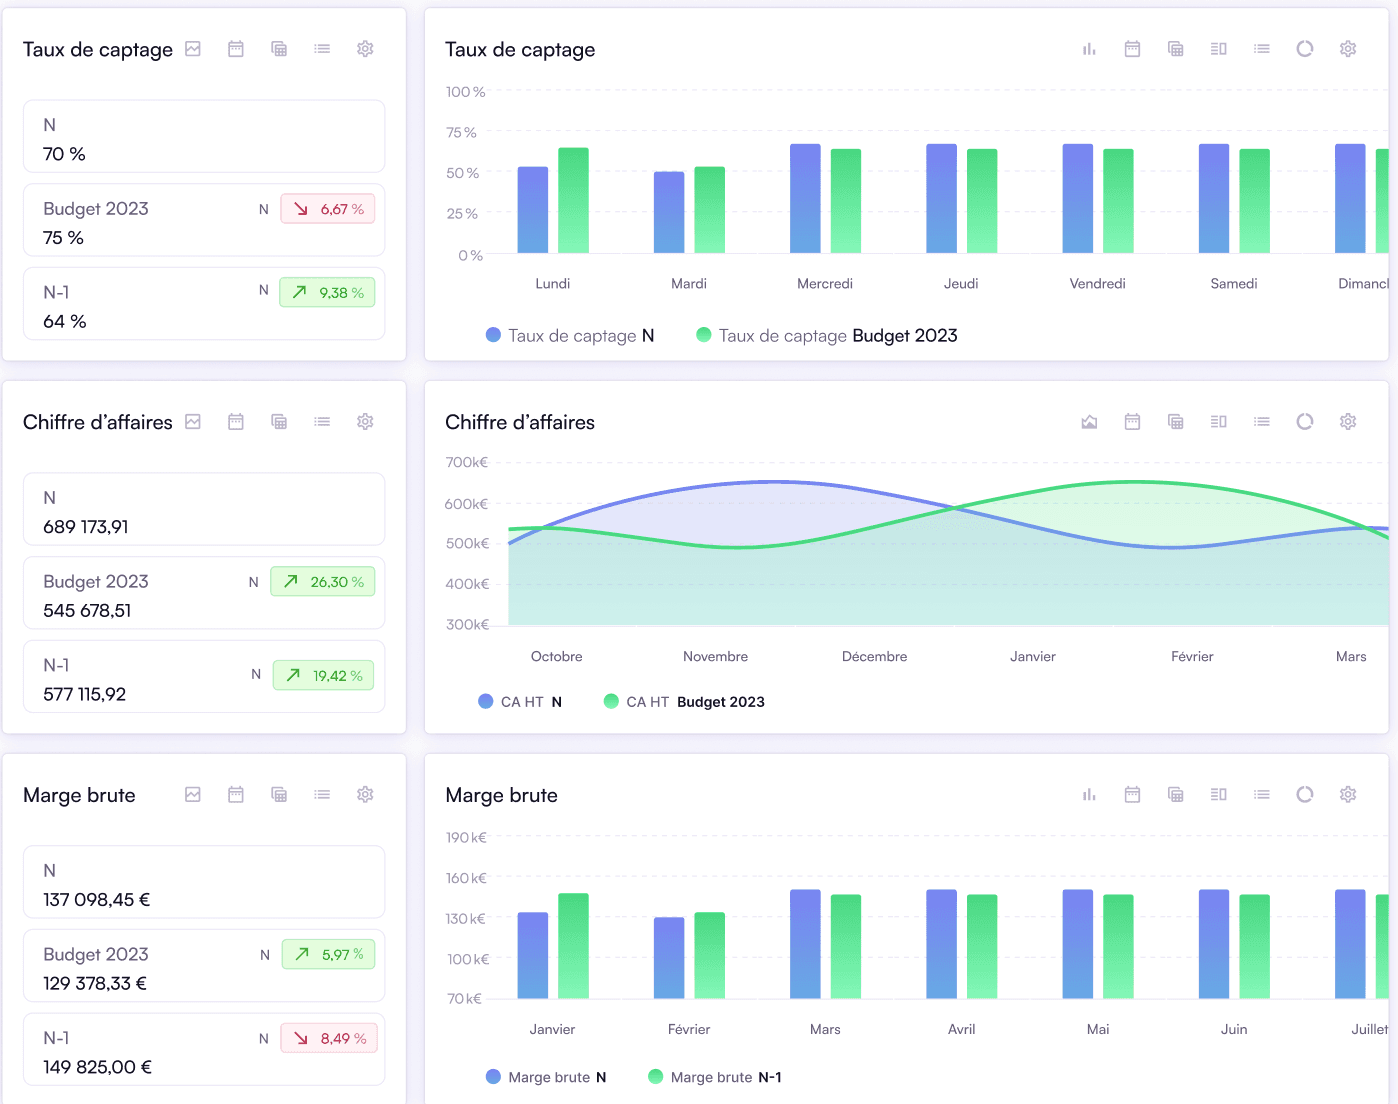
Create Dashboards
Your performance indicators have been perfectly chosen? You can now group them on a dashboard. The purpose of the dashboard is to present all the company's performance indicators on a synthetic platform accessible to all members of the company. They are built with performance indicators and allow for easy visualization of the overall success of the company. Numerous visuals can be used such as graphs, diagrams, tables, curves. It’s up to you to find THE visual that will make understanding your performance indicators more obvious.
The advantage of the dashboard compared to a report is that the dashboard is immediately understandable. It is very easy to visualize potential cash flow discrepancies, strengths, and weaknesses of the company’s activities. To keep it simple, understandable, and effective, it is advisable to use a limited number of indicators when creating a dashboard.
Regularly Adapt Your KPIs
You can now disseminate these dashboards within your company so that everyone can access them and track their objectives. It is important to perform regular monitoring of these indicators to be aware of the direction performance is taking within your company.
Finally, keep in mind that your objectives may change over the life of your company. Nothing prevents you from changing your indicators to replace them with others that would be more relevant.
From Performance Indicators to Dashboards
As briefly explained earlier in this article, the realization of dashboards is the step that follows the choice of key performance indicators. They are indispensable and are a true communication tool between the different departments of a company. But what is a dashboard for? And how to construct it?
What is a Dashboard For?
The dashboard is based on the fixation of relevant objectives. It is a true tool for monitoring and guiding performance that allows you to visualize at a glance the entire financial situation of your company.
A dashboard serves to:
Set objectives,
Monitor and evaluate the financial health and performance of your company,
Ensure that all strategies implemented function stably and allow for the achievement of objectives,
Facilitate communication between teams.
It allows for a representative, clear, understandable, and effective translation of the different chosen performance indicators.
How to Build a Dashboard?
Building a dashboard is simple once all the performance indicators have been defined.
To create a relevant dashboard, it is important to filter through all the listed performance indicators to keep only those that are the most representative concerning the company’s activity.
Then, it will be necessary to choose a format that allows for quick visualization, effective analysis, and relevant decision-making. Certain formats may be more judicious than others. We can distinguish graphs, diagrams, curves, scatter plots, tables, and many others.
The main data will appear clearly on the chosen visual and it will be easy, regardless of the qualifications of each collaborator, to understand what it means. It should be easy to use, fill out, and clear.
It will be important to communicate about the dashboard to inform all collaborators about the objectives, whether they are achieved or not.
The dashboard must be updated in real-time based on the evolution of results, data measured by the indicators, etc.
It is also possible to add features allowing annotations or comments to further facilitate communication.
The dashboard, once built and effective, will prove to be an essential pillar for the development and strategy of the company.
In Conclusion:
Key performance indicators play a very important and non-negligible role within a company.
They may be different depending on the sector of activity, but their goal remains the same: to inform about the company’s performance.
The more relevant the KPIs are, the more representative the results will be of reality. They inform the company about whether or not it is meeting its objectives.
All their measured data will then be recorded in a clear, understandable, and accessible dashboard for all company collaborators, which will promote communication between teams.
F.A.Q:
What is a performance indicator (KPI)?
A performance indicator, also known as a KPI (Key Performance Indicator), is a tool for measuring a company's performance. It allows both for measuring the company’s financial health and for orienting the decision-making processes of the leaders.
What are the different types of performance indicators?
There are various types of performance indicators, such as financial and accounting indicators, operational indicators, sales indicators, marketing indicators, and customer service indicators. Each of these indicators measures the company’s activity in a specific area.
Why is it important to choose the right performance indicators for your business?
It is important to choose the right performance indicators for your business as they allow for effective measurement of whether the company is being properly managed and can alert leaders as soon as the situation deteriorates so that they can opt for a strategic change and make necessary decisions. However, implementing these indicators requires a method to ensure effectiveness.